The Occupancy Report provides a historical report of occupancy by Room during a specific date range. This report is typically used to analyze past Occupancy %, ADR, REVPAR by Room.
There is a one year date range limit. Reports can be run for one year at a time, starting on any date you choose (past or future), but will be limited to one year.
To see the details of the bookings summarized in the Occupancy Report, run the Bookings Production Report for the same date range.
For a summary of the Sources of these bookings, go to the Bookings Report
To see the Revenue generated during the date range, use the Revenue Report.
Occupancy Report Rules
- The Room Revenue, ADR and REVPAR is calculated on actual Income of past bookings calculated from RENT postings on the folio for the bookings charged, i.e. real Room Rent postings rather than how the booking was sold. Bear in mind this will render the Occupancy report financials to 0 for running in the future or even current date.
- If you check "Deduct Out of Order Rooms", then Out of Order Rooms are deducted from the total number of rooms in the first column "Total Rooms" in the Report. For example, if you have 50 rooms, and 2 rooms are OOO on a given date and you choose to deduct out of order rooms, then 48 rooms will be used to calculate occupancy for that date. See Out of Order Rooms Reports
- Rooms that are set to "Ignore on Occupancy Report" will be deducted from the total number of rooms in the first column "Room" in the Report. See Rooms
- To see 'revenue' during the same period, go to the Revenue Report and run it for the same date range. NOTE:There are times when Night Audit timing may cause discrepancies in the Revenue and Occupancy reports. Occupancy and Revenue are different reporting paradigms and not intended to be equal at all times. Revenue is RENT posted to a folio during a specific time frame. Occupancy is ROOMS occupied. See this KB Article for further explanation.
- Occupancy Dashboard Widgets : "Todays Occupancy By Channel" and "Todays Occupancy by Room Types" widgets are written to be consistent with the Occupancy Report and In House Report. Thus, there are situations where these 'dashboard widgets' data will be different than one might expect. The condition that makes the occupancy widgets report differently than the 'available rooms' value displayed on the Tape Chart and Availability Charts occurs when a booking was checked in and then checked out on the same day (what we refer to as 'same day checkin checkout'). In these cases, bookings that were 'same day checkin checkout' affect the Booked Rooms and the Available Rooms results on the widgets. These bookings appear on the In-House report for the day, as that booking was in-house - if even for a moment. And will appear on the Occupancy Report for the day, as well. But the room it occupied will be available via all booking channels, with the exception it cannot be re-booked by clicking on the Room via the Tape Chart, as the prior 'same day checkin checkout' booking is appearing there for 'today' till a new booking is assigned for that room. Thus, when considering occupancy and available rooms, the system will show accurate availability to your channels (for example to your front desk, website, and OTA, etc) and that Room will appear on the Vacant Room report, as it is free to rent again. But because that room that was briefly occupied, but checked out the same day, it affects the Occupancy Report, the In House report, as the widget's data are built to conform to these reports.
Automatic emailed "Push" reports in MyPMS: MyPMS Automated Reports gives you the ability to schedule daily delivery of the "Manager", "Occupancy" and "Revenue" Reports to a primary email and cc email if needed. The Automated Occupancy Report data is based on occupancy for all room types, accounting for the OOO Rooms flag for the past 30 days, from the previous day's date. To set up an automated Occupancy Report, see Automated Reports
Key Differences between the Occupancy and Occupancy Forecast Reports
- The Occupancy Report is based on past reservations, while the Occupancy Forecast is based on future reservations.
- The Occupancy report requires a room assignment, while the Occupancy Forecast does not;because a room may not have been assigned yet.
- Total number of rooms available on the given date will reflect any rooms set to "Ignore on Occupancy Report" (See Rooms) For example, if you have 20 rooms and 2 are set to ignore on Occupancy Report, then total rooms available will be 18.
- The Occupancy Report displays total number of rooms available including the OOO rooms with the option of deducting "OOO" Rooms from the Rooms Available total. For Example, if you have 20 Rooms available and 2 are OOO, The Total Rooms Available will show 20 Unless you check the option to "Deduct Out of Order Rooms". See below.
- The other key difference is when you run the Occupancy Forecast Report, you can choose to include or exclude Group Booking allocations. This setting changes the total # of rooms. See a detailed description below.
- In summary, the reports are pulling two different data sets that will provide different results.
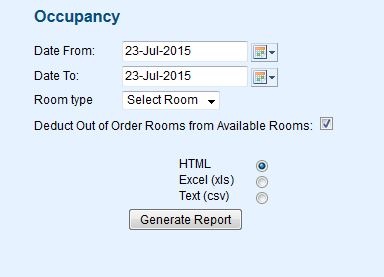
To run an Occupancy Report, follow these steps:
- Date From: Choose a Date Range. This can be one date as shown in the example or a range.
- Room Type: Choose a specific Room Type or just leave on "Select Room" to see all room types.
- Deduct Out of Order Rooms from Available Rooms: Check this box if you DO NOT want to include OOO rooms in the Occupancy Report calculations.
The Report contains the following fields: Date: When run in a single or multi day query, each date will be broken down into a unique line.
- Date: Date by day.
- Total Rooms: Total number of rooms available on the given date. The total will reflect any rooms set to "Ignore on Occupancy Report". See and any rooms put Out of Order. For example, if you have 20 rooms and 2 are OOO, then total rooms available will be 18.
Occupied Rooms: Number of rooms occupied on the given date. - Occup %: Occupancy Percentage is calculated by dividing the number of occupied rooms by the total number of rooms.
- Revenue: The revenue generated for the actual rent charged for the booking on the given day. This is calculated from the actual charge on the folio.
- ADR: Average Daily Rate is calculated by dividing the total Room Revenue by the number of occupied rooms for the date returned.
- REVPAR: There are two industry standards for calculating REVPAR. 1) Total Room Revenue for the date range divided by total number of available rooms for the same date range. 2) Average Daily Rate multiplied by Occupancy %. We utilize method two in all reports and reach your REVPAR by (ADR * OCC%). See Report Terms
See a Sample Occupancy Report.
Overview
Content Tools